 Fractiz
Context. Conviction. Data-driven research.
Trading research built for people who want evidence before risk.
Explore market patterns, test strategies with discipline, and build a system that holds up when conditions shift.
Patterns
Spot what the market is doing before you act
Strategies
Test your ideas against real data, not gut feel
Statistics
Know if your results are real or just noise
Strategy Library
Ideas should earn their place through behavior, not branding.
Browse the strategies, understand the thesis behind each one, and run your own backtests.
Strategy
Breakout Continuation
Donchian-channel breakout. Goes long on a break above the prior N-bar high, short on a break below the prior N-bar low. Bidirectional, bracket exits.
Strategy
Pullback Reversion
Long-only dip buyer. Waits for price to pull back to a short moving average inside an uptrend, then enters on the bounce with a fixed-points bracket.
Strategy
Pattern Rotation
Volatility-filtered Donchian breakout. Trades the channel break only when an ATR ratio classifies the regime as expanding; stays flat when volatility is contracting.
Backtesting
Test your thesis before you risk real capital.
Pick a strategy, choose contracts and timeframes, set your date range, and submit. Results come back with PnL, win rate, drawdown, equity curves, and order-level detail.
Configure the run
Select strategy, contracts, timeframe, date range, and initial capital.
Submit and wait
The engine runs your backtest. Results are ready in seconds to minutes depending on complexity.
Review the results
Equity curve, trade log, risk metrics, daily breakdown. Everything you need to decide if the strategy holds up.
Sample Configuration
Sample Results
Net PnL
+$4,230
Win Rate
58.3%
Total Trades
127
Max Drawdown
-$2,210
Illustrative backtest sample, not live trading results.
Patterns
Markets repeat. The edge is in recognizing the shape before it completes.
Fractiz checks for patterns across multiple frameworks: microstructure setups, harmonic ratios, Gann geometry, and time cycles. Each framework looks at the market through a different lens. Multiple perspectives give you more to work with when building conviction.
Your Research Workspace
Backtests, Patterns, and VIBE. One place to do the research.
The dashboard brings together everything you need for a focused research session. Explore patterns, test your strategies, and review the results.
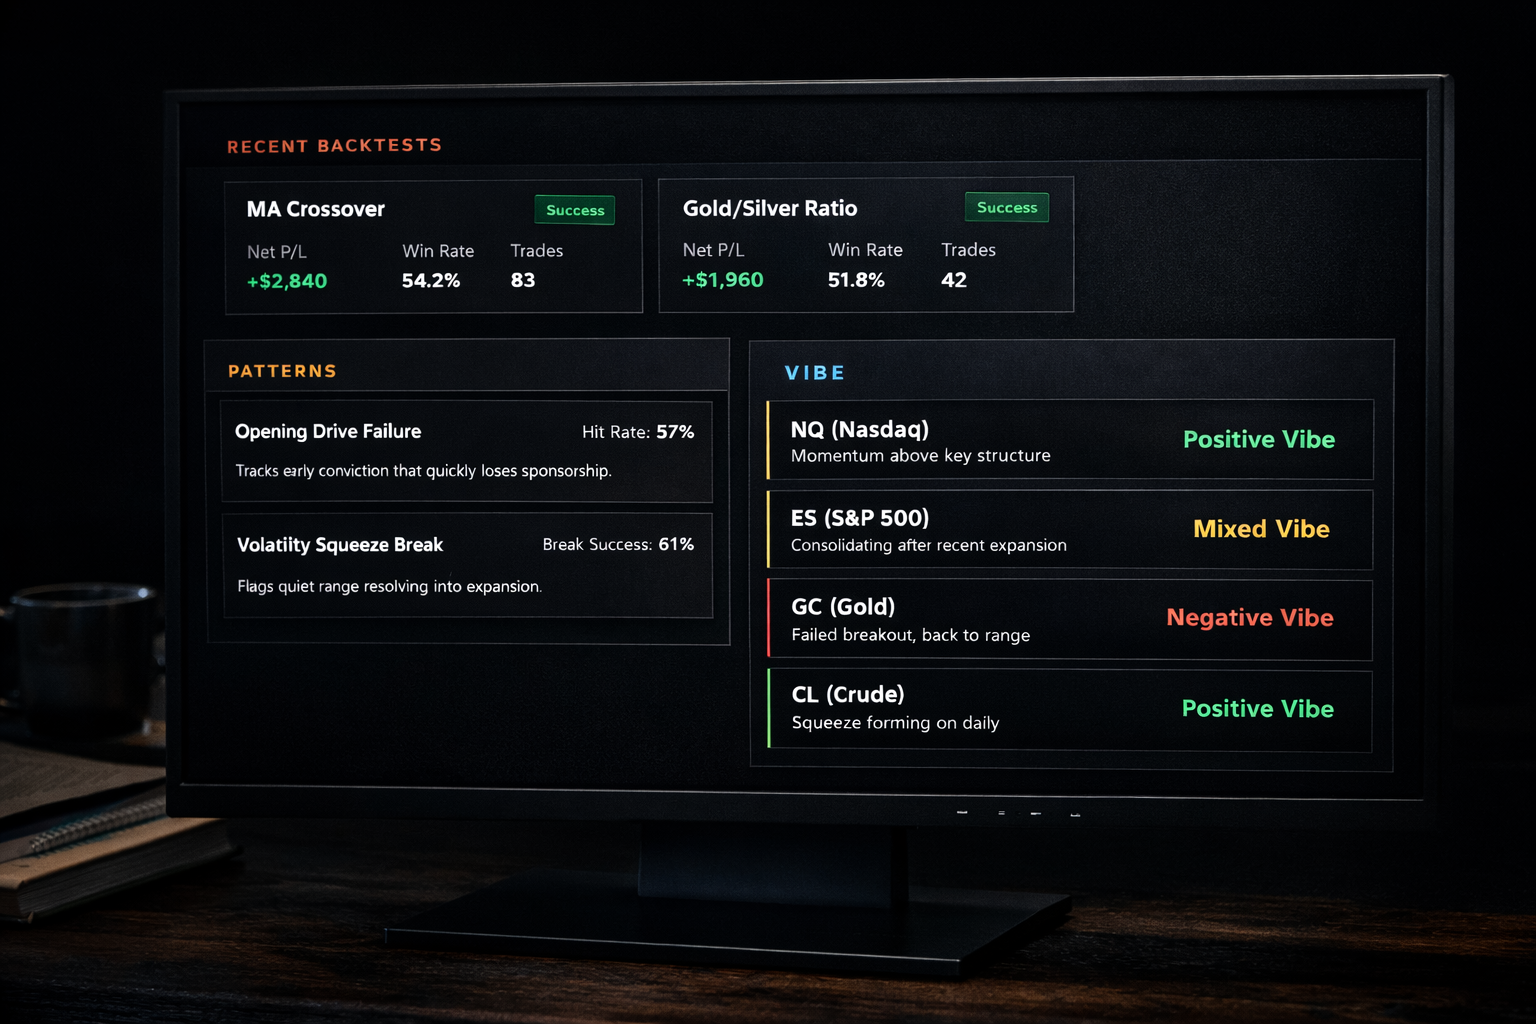
NQ (Nasdaq)
Positive
Momentum holding above key structure
ES (S&P 500)
Mixed
Consolidating after recent expansion
GC (Gold)
Negative
Failed breakout, reverting to range
CL (Crude)
Positive
Squeeze break forming on daily
VIBE Coming soon
A probabilistic market-state read based on pattern, behavior, and time-cycle context.
VIBE covers instruments like Nasdaq, Gold, Crude, and more. A probabilistic read to complement your research.
Workflow
Research that holds up follows a process, not a hunch.
01
Backtest
Test your strategy against historical data. See how it performs across the contracts and timeframes you care about.
02
Validate
Run the same strategy on a period outside the backtest window. If the edge disappears out of sample, you caught it early.
03
Stress Test
Try different timeframes, longer windows, different conditions. Find where the strategy breaks before the market does.
04
Monitor & Iterate
Track how the strategy performs going forward. When the results drift, come back and retest. Good research is a loop, not a straight line.
Past performance does not guarantee future results. Markets can change faster than models, narratives, or conviction.
Read disclaimer